
Contents
Nvidia had its worst week on the stock market since April 2025. Its shares fell 12.75% to $162.85 in the week to 13 November, the week its board accepted Jensen Huang's resignation as chief executive.
Here is what Nvidia itself has filed, what the price chart shows, and what to watch when it reports results on 17 November.
Nvidia share price this week
| Day | Nasdaq close | Change |
|---|---|---|
| Fri 6 Nov | $186.64 | |
| Mon 9 Nov | $178.67 | −4.27% |
| Tue 10 Nov | $168.89 | −5.47% |
| Wed 11 Nov | $173.73 | +2.87% |
| Thu 12 Nov | $166.19 | −4.34% |
| Fri 13 Nov | $162.85 | −2.01% |
- Thursday was the most volatile day. On the day Nvidia announced the change of CEO, the shares opened at $151.01, 13.1% below Wednesday's close, and touched $148.80. They closed at $166.19, down 4.3%.
- $148.80 was the lowest price since June 2025, and Friday's $162.85 was the lowest close since July 2025.
- This was the sixth weekly fall in a row. The shares closed at $233.95 on 2 October; they are 30.4% lower six weeks later.
- About 2.34 billion shares changed hands in the week, about 3.4 times its 20-week average and the most since April 2025.
Data provided by Twelve Data.
What Nvidia's filing says about the CEO change
Nvidia reported the change in a Form 8-K filed with the US Securities and Exchange Commission on 12 November. The filing says:
- Jensen Huang resigned. On 11 November the board accepted his resignation as President, Chief Executive Officer and member of the board, effective immediately.
- Colette Kress is interim CEO. Nvidia's CFO since 2013, she runs the company while the board searches for a new chief executive, and she remains CFO.
- Harvey C. Jones is chair. A director since 1993, he was appointed Chair of the Board on 11 November. He has been Managing Partner of Square Wave Ventures, a private family office, since 2004.
- No reason is given. The filing does not say why Huang resigned. News reports have discussed the circumstances; we have kept to what the company has filed.
Weekly chart: a bearish breakdown below the Ichimoku cloud
Nvidia's weekly chart has undergone a significant bearish structural breakdown, potentially marking a transition from its long-established bullish trend into a corrective phase.
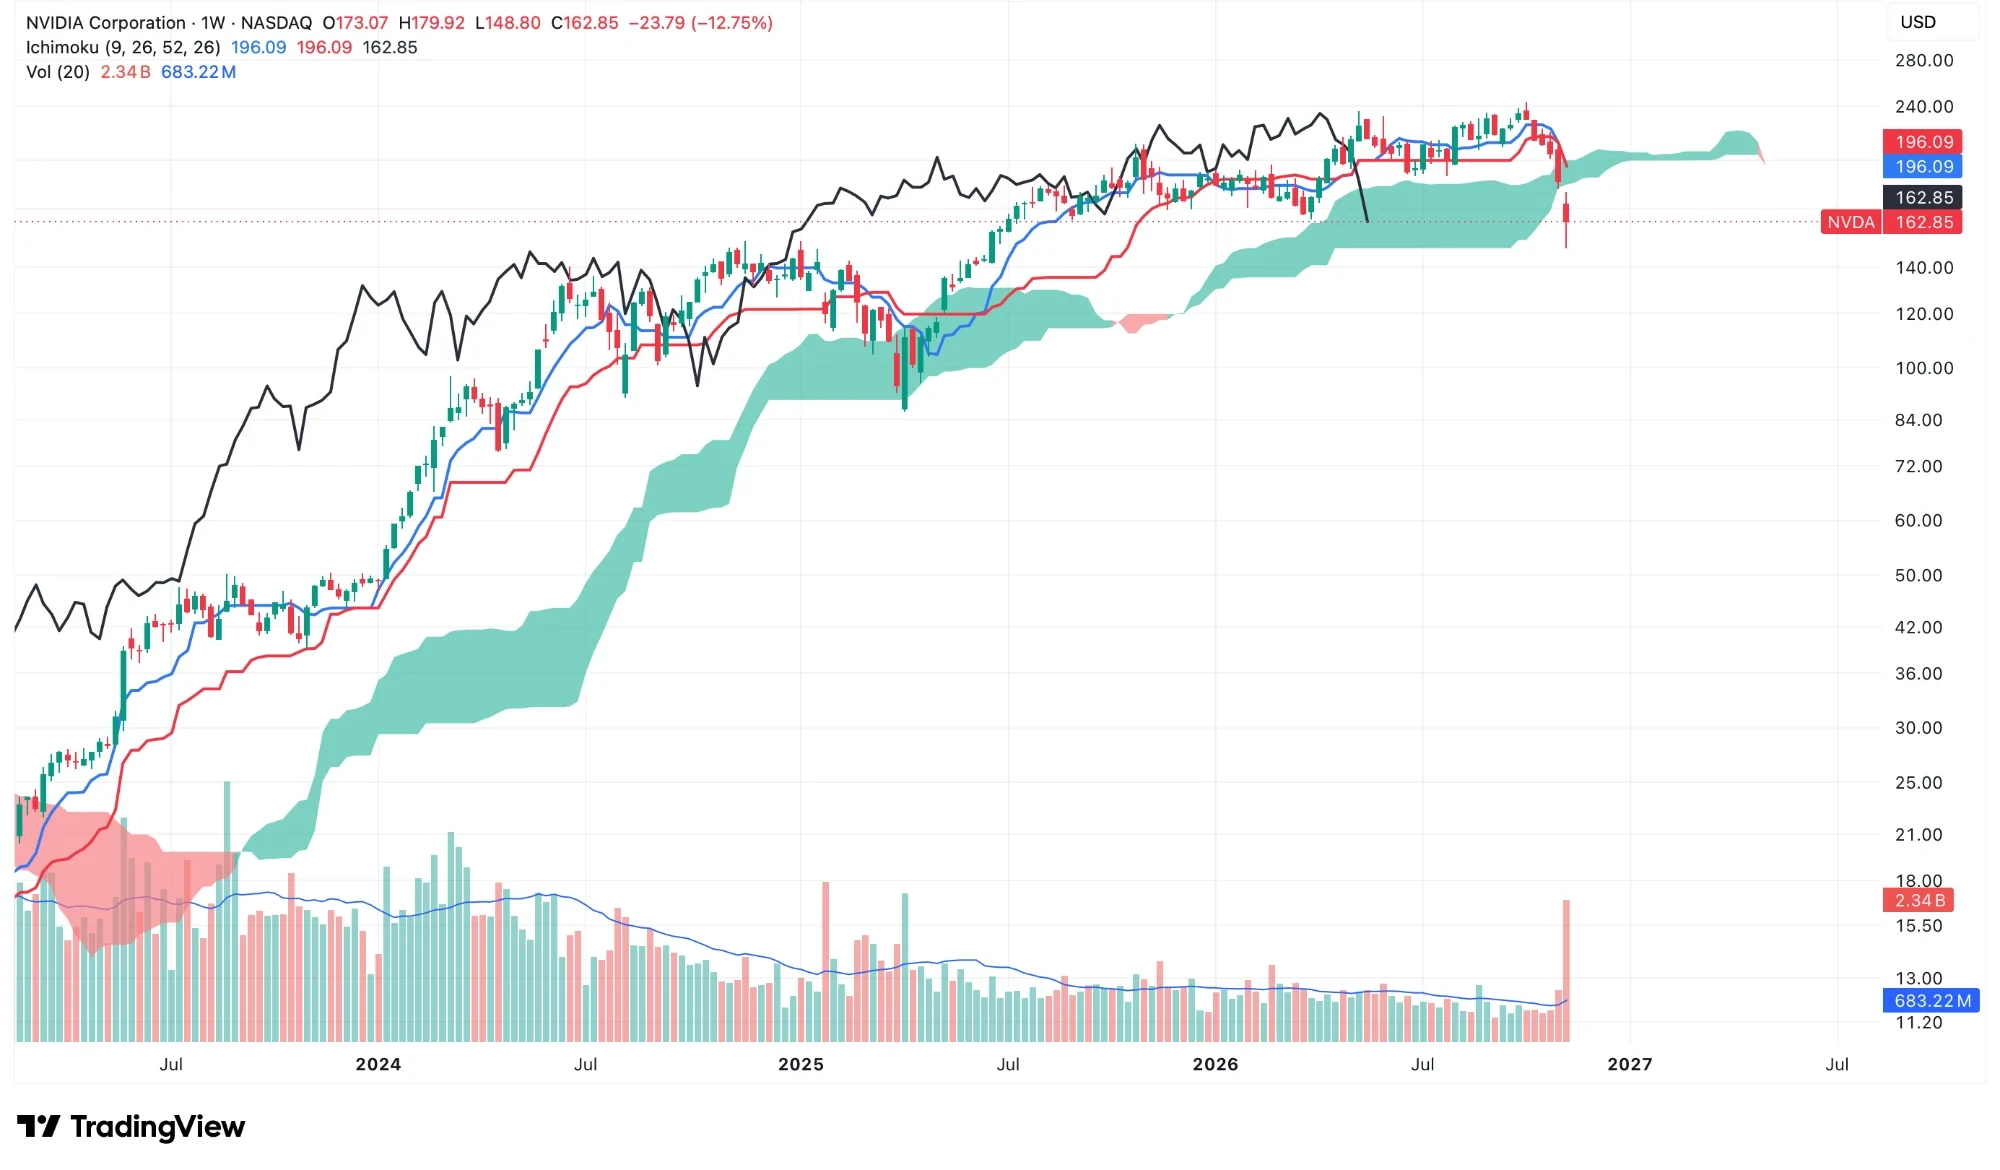
How to read it:
- Conversion line (Tenkan, blue): the midpoint of the highest and lowest prices of the last 9 weeks.
- Base line (Kijun, red): the same midpoint over the last 26 weeks.
- The cloud: the shaded band, drawn 26 weeks ahead from those lines and the 52-week range. Green means the faster edge is above the slower one; red means the reverse.
- Lagging line (Chikou span, black): each week's close, drawn 26 weeks back.
What the chart shows
- Cloud breakdown: Price has decisively fallen below the weekly Ichimoku cloud, indicating a deterioration in the medium-term trend and loss of an important dynamic support zone.
- Tenkan–Kijun weakness: Both lines are converging near $196, substantially above the current price of $162.85. This establishes a major overhead resistance zone.
- Chikou Span confirmation: The lagging span (black line) has turned sharply lower, reinforcing the weakening momentum structure.
- Volume confirmation: Weekly volume of 2.34 billion shares is approximately 3.4 times its 20-week average, suggesting unusually heavy selling pressure and making the breakdown more significant.
- Critical levels: Immediate support lies around $148–150, followed by $140. A sustained recovery above $180 and eventually $196 would be required to begin repairing the technical structure.
Technical outlook: bearish
Although the forward cloud remains predominantly green, suggesting that the longer-term bullish structure has not completely unwound, the combination of a cloud breakdown, weakening Ichimoku components and exceptionally high selling volume raises the probability of an extended correction.
The immediate risk is that the former Ichimoku support zone now becomes resistance, with any recovery potentially facing substantial selling pressure. A weekly close back inside the cloud would be an important first sign of stabilisation.
This reading is based on past prices. It is not a recommendation to buy or sell.
How Microsoft and Broadcom moved the same week
Two other large US technology shares went in different directions the same week.
Data provided by Twelve Data.
- Broadcom rose 18.16% to $347.01, though it is still 27.9% below its June closing high. News reports linked the rise to investors turning to Nvidia's rivals, including companies that design custom AI chips for large cloud firms.
- Microsoft slipped 1.27% to $523.88, 5.7% below the closing high it set on 4 November.
What Nvidia reported last quarter
Nvidia's last results, for the second quarter of fiscal 2027 (the three months to 26 July 2026), were published on 26 August.
| Q2 FY27, to 26 July | Figure | Year on year |
|---|---|---|
| Revenue | $96.2 billion | +106% |
| Data Center revenue | $89.0 billion | +117% |
| Gross margin (GAAP) | 75.0% | |
| Net income (GAAP) | $59.7 billion | +126% |
| Diluted EPS (GAAP) | $2.46 | +128% |
- Data Center was about 93% of revenue. This is the business that sells AI chips and systems to cloud companies and other data-centre operators.
- Nvidia returned about $26.0 billion to shareholders in the quarter through buybacks and dividends, and had about $99.0 billion left under its buyback authorisation.
What to watch in the 17 November results
Nvidia will publish results for the third quarter of fiscal 2027, which ended on 25 October, at about 1:20 pm Pacific time on Tuesday 17 November (about 2:50 am IST on Wednesday 18 November). The conference call follows at 2 pm Pacific time, 3:30 am IST.
The company's own outlook, given in August:
| Q3 FY27 outlook | Nvidia's figure |
|---|---|
| Revenue | $108.0 billion, plus or minus 2% |
| Gross margin | 74.0%, plus or minus 0.5 points |
| Operating expenses (GAAP) | About $9.2 billion |
| China | No Data Center compute revenue from China assumed |
- Revenue against the company's own range, which works out to $105.8 billion to $110.2 billion.
- Data Center revenue, which was $89.0 billion last quarter.
- Gross margin against 74.0%.
- Any word on the CEO search. These will be the first results under Colette Kress as interim CEO; as CFO she also publishes the written commentary that comes with the results.
How investors in India can own Nvidia shares
Nvidia is listed on Nasdaq in the US. It is not listed on NSE or BSE.
- Directly: through an overseas brokerage account. The Reserve Bank of India's Liberalised Remittance Scheme lets a resident individual send up to US$250,000 abroad each financial year, including for buying shares.
- Indirectly: through Indian mutual funds that invest overseas, some of which hold US technology shares. Industry-wide overseas limits have at times led some schemes to stop taking new money, so check a scheme's current status first. Our guide to global investing through GIFT City funds explains one route.
- Currency matters. Returns in rupees depend on the dollar-rupee rate as well as on the share price.
A single share, however well known, is a concentrated bet. If you are thinking about global shares, Genvest's global portfolio advisory looks at how they fit with the rest of what you own. For India's own chip companies, see our guide to semiconductor stocks in India.
Prices are Nasdaq closing prices in US dollars, as of Friday 13 November 2026. Price data provided by Twelve Data; chart by TradingView.
This article is for information only. It is not investment advice or a recommendation to buy, sell or hold any security.