
Contents
The Nifty 50 has entered one of its more important technical zones in recent years.
After trading above 26,000 earlier in 2026, the index has corrected sharply and closed at 22,421.95 on October 1, with the week's low reaching 22,217.30. The index has also been under pressure for several consecutive weeks, bringing it back close to the April 2026 lows.
But the interesting part is not simply that Nifty has fallen.
Several long-term technical measures are now converging around roughly the 22,100–22,400 zone.
That makes the next few weeks particularly important for long-term investors.
Our reading of the chart is straightforward:
Nifty is in a corrective market structure, but it has now reached a zone from which a meaningful recovery attempt can emerge. The key question is no longer whether the market has corrected—it is whether this support produces a durable bottom or merely a temporary bounce.
Let us examine the evidence.
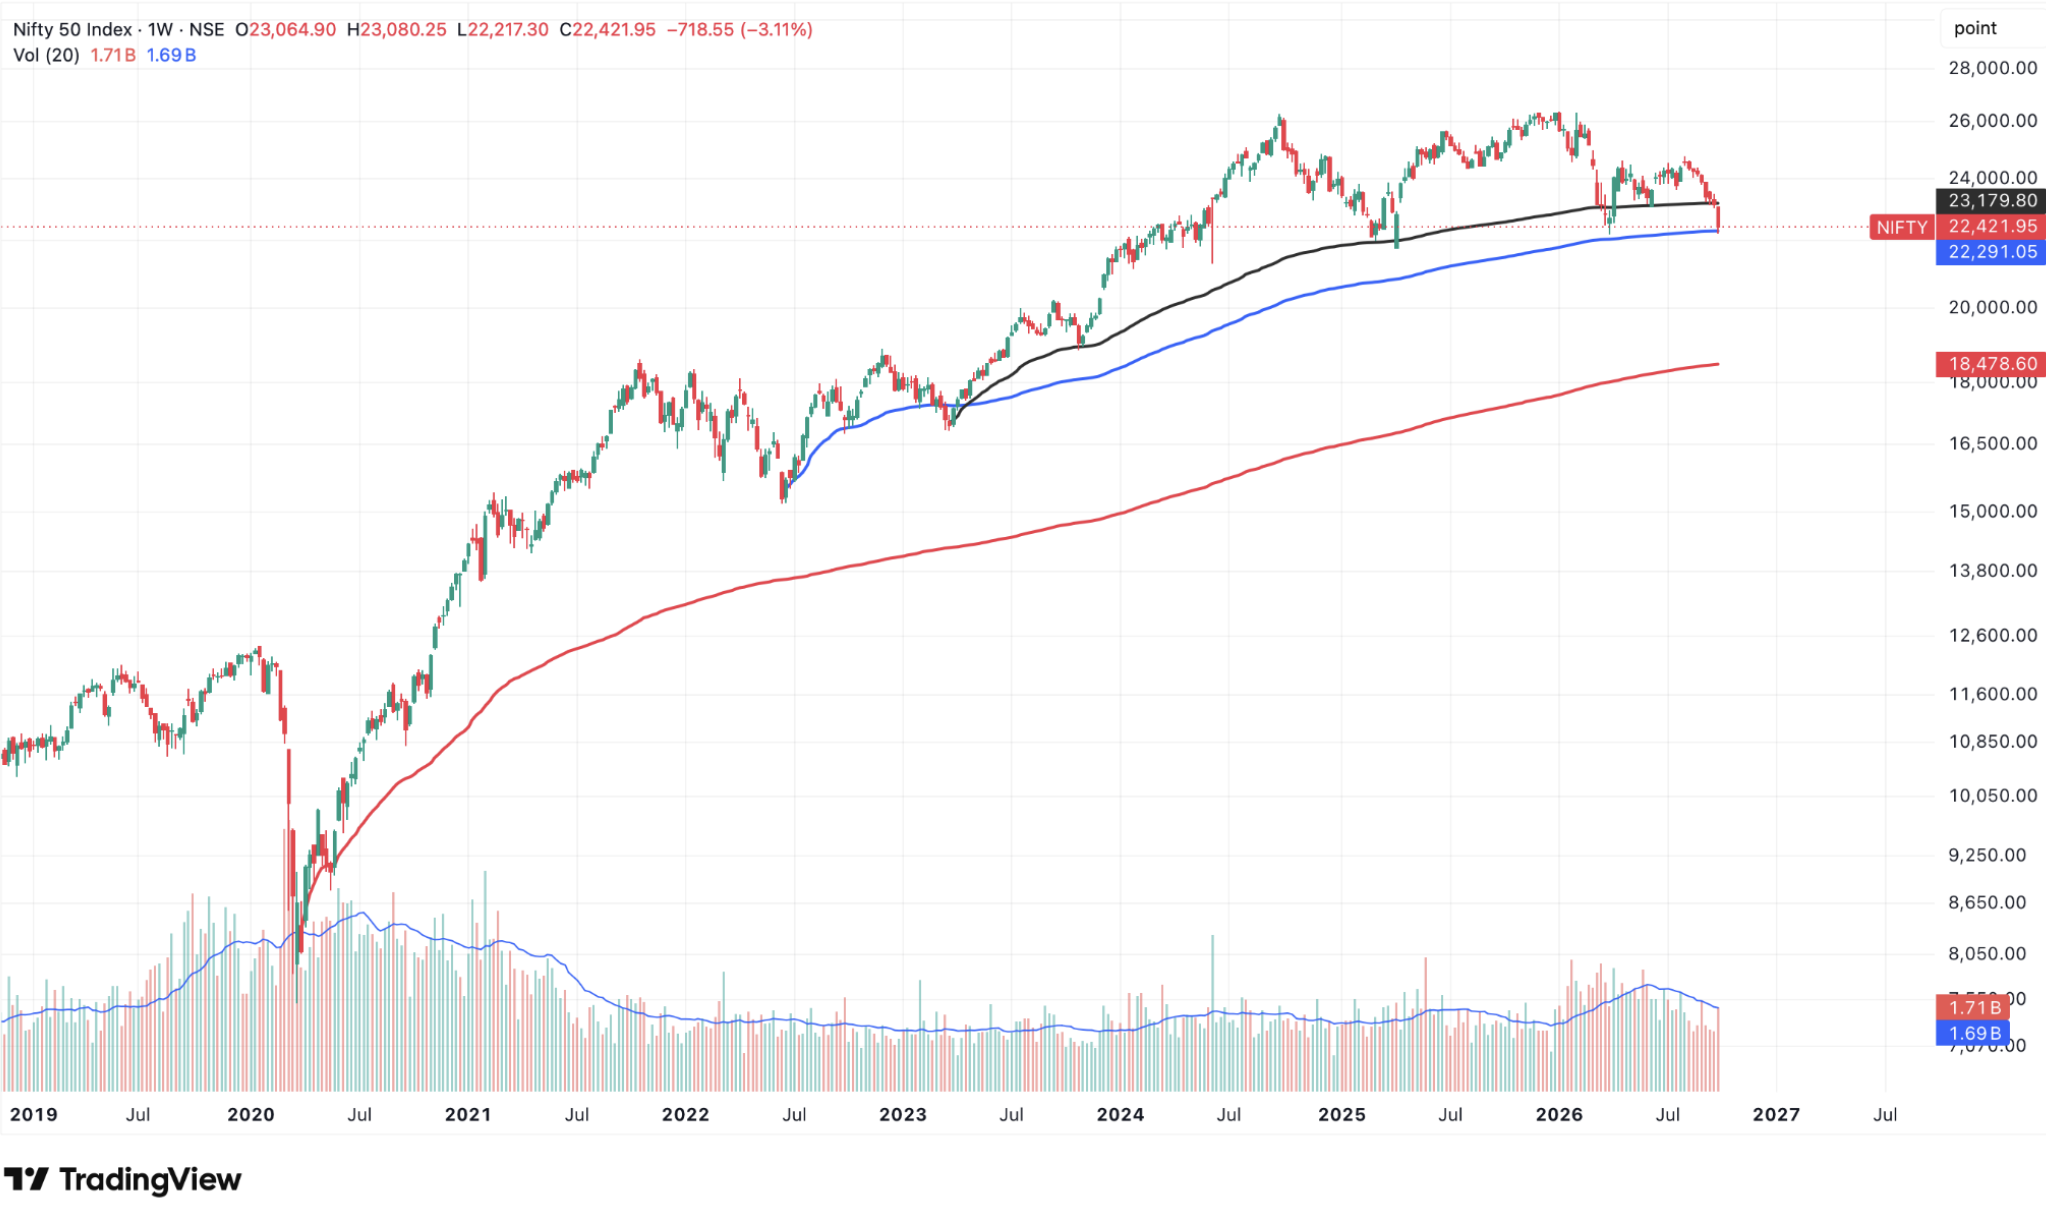
Three Anchored VWAPs Tell the Story of the Indian Bull Market
One useful way of understanding the Nifty's long-term structure is through Anchored VWAP, or AVWAP.
Unlike a conventional moving average, Anchored VWAP calculates the volume-weighted average price beginning from a specific event or market turning point. TradingView defines it as the volume-weighted price beginning at a user-selected anchor on the chart.
For the Nifty, three particularly important anchors tell the story of the post-Covid bull market.
March 2020 AVWAP
The March 2020 Covid crash was the beginning of the entire post-pandemic equity cycle.
The AVWAP beginning from that low is currently around 18,480.
This represents a very long-term reference point. Nifty remains comfortably above it, which means the structural post-Covid advance has not been completely reversed.
However, this level is far enough below current prices that it should not presently be treated as the market's immediate downside target.
June 2022 AVWAP
June 2022 marked another important market low following the Russia-Ukraine conflict, aggressive global monetary tightening and a sharp correction across risk assets.
The AVWAP beginning from that low is currently close to 22,290.
And this is where things become interesting.
Nifty is now trading almost exactly around this price.
In other words, the market has retraced much of the advance that began in mid-2022 and is testing one of the most important price-volume reference zones of the last four years.
March 2023 AVWAP
The third anchor begins around March 2023.
What followed was one of India's strongest recent bull-market phases.
From 2023 through much of 2024, Indian equities saw extraordinary participation across PSUs, defence, infrastructure, railways, capital goods and smaller companies.
The AVWAP beginning from that market low currently lies near 23,180.
Nifty is now below it.
That is important because this AVWAP is no longer immediate support.
It should increasingly be viewed as the first important resistance zone during a market recovery.
Why 22,100–22,400 Is More Important Than a Single Number
Technical analysis tends to become less useful when investors focus obsessively on one exact index level.
The stronger signal here is that several independent price structures are sitting within the same broad region.
Our calculations currently put them approximately here:
| Technical reference | Approximate Nifty level |
|---|---|
| 38.2% retracement of the June 2022–January 2026 advance | 22,100 |
| April 2026 swing low | 22,183 |
| Long-term monthly moving-average region | ~22,200 |
| June 2022 Anchored VWAP | ~22,290 |
| 200-week EMA region | ~22,380 |
That creates a broad technical cluster between approximately 22,100 and 22,400.
External technical commentary is also focusing on this area. The October 1 weekly low at 22,217 has been highlighted as an important level, with the April 2026 low around 22,182 immediately below it.
This does not mean Nifty cannot fall below 22,200.
It means that what happens around this zone should provide considerably more information about the next phase of the market.
The Bigger Warning Comes From the Monthly Chart
The weekly chart tells us where support lies.
The monthly chart tells us why investors should still remain cautious.
One of the clearest changes has occurred in monthly RSI momentum.
Nifty's monthly RSI was above 80 during the powerful 2024 phase.
When the index subsequently revisited record territory, momentum did not confirm the new highs with the same strength.
That produced a classic feature often seen toward the later stages of a trend:
price remained strong, but momentum was gradually weakening underneath.
The current monthly RSI has fallen back below the important 50 region.
That tells us that the longer-term market momentum is materially weaker than it was during the 2023–24 advance.
This is why simply saying:
“Nifty has corrected enough, therefore the bottom must be in”
would be premature.
The price has reached support.
The monthly trend has not yet repaired itself.
But Weekly RSI Is Giving One Encouraging Signal
Interestingly, the weekly chart is beginning to show something different.
During the April 2026 decline, weekly RSI fell to roughly 28.
Nifty is now again trading around comparable price levels, but weekly RSI is closer to 31.
That creates an early form of positive momentum divergence.
In simple terms:
Nifty has returned to its previous lows, but the underlying momentum is currently somewhat less weak than it was earlier.
This can sometimes happen during the process of forming an intermediate market bottom.
However, RSI divergence should never be treated as confirmation by itself.
For the signal to become more meaningful, we would want to see:
price defend the current support area → form a higher low → reclaim approximately 23,200 → eventually move back above the 23,800–24,000 region.
Until that happens, the divergence merely tells us to remain open to the possibility of a recovery.
Is Nifty Completing an Elliott Wave Correction?
Elliott Wave analysis can provide another useful framework, although it should never be treated as an exact forecasting system.
One plausible interpretation of the longer Nifty structure is that the major advance beginning after the 2020 Covid crash eventually completed a larger five-wave sequence around the 2024–26 highs.
The current decline can then potentially be viewed as an A-B-C corrective structure.
A simplified interpretation would look like this:
-
Wave A: approximately 26,373 → 22,183
-
Wave B: approximately 22,183 → 24,774
-
Wave C: potentially still underway
The interesting mathematical feature is that Wave A declined by approximately 4,190 points.
If Wave C eventually became similar in magnitude, it would produce a theoretical objective around:
24,774 − 4,190 ≈ 20,600
That does not mean Nifty will reach 20,600.
But the region becomes more interesting because other retracement measurements also converge around approximately 20,500–20,800.
We therefore regard that area as a deeper correction scenario, rather than our immediate base case.
For that scenario to become relevant, Nifty would first need to lose the current 22,100–22,200 support zone convincingly.
Three Nifty Levels Investors Should Watch
Rather than predicting one precise market outcome, we prefer to use a scenario framework.
1. Around 22,100–22,400: the immediate battleground
This is the most important support area.
A strong rejection from this zone, followed by improving market breadth and a higher weekly low, would provide evidence that the correction may be entering a stabilisation phase.
A decisive breakdown followed by an inability to reclaim the area would materially weaken the structure.
2. Around 23,150–23,250: first major recovery test
This region roughly coincides with the Anchored VWAP beginning from the March 2023 market low.
Nifty moving above it would be constructive.
But one or two trading sessions above this level would not necessarily signal a new bull market.
The more important question would be whether the index can remain above it during the next pullback.
3. Around 23,800–24,000: meaningful trend repair
This is where several medium-term moving-average references are currently clustered.
A sustained recovery above this region, accompanied by improving breadth, would represent significantly stronger evidence that the market has moved beyond merely producing an oversold bounce.
What Happens if 22,200 Breaks?
Investors should also understand the downside scenario in advance.
If Nifty falls convincingly below the present support and is subsequently unable to reclaim it, the next meaningful region lies around approximately 21,600–21,750.
Below that, the 20,500–20,800 region becomes increasingly relevant from a combination of retracement analysis and the possible Elliott Wave structure.
This is very different from saying that Nifty is “going to 20,500.”
Markets do not follow predetermined paths.
The objective is instead to know what evidence would cause us to change our assessment.
That distinction is particularly important in volatile markets.
Broader Markets Are Sending an Interesting Message
One unusual feature of the recent correction is that the weakness has not always been uniform across market segments.
Our comparison of recent weekly data showed that over an eight-week period, Nifty 50 declined more than both Bank Nifty and the Nifty Smallcap 100.
That relative resilience is important.
However, in the latest week, weakness in smaller companies became more noticeable as well.
This is something we would watch closely.
A durable market bottom often develops when fewer stocks participate in each successive decline.
The opposite is also true.
If stocks and sectors that had previously resisted the correction suddenly begin breaking their long-term support levels, it would suggest that the correction is broadening rather than ending.
Foreign Investor Selling Remains Another Variable
Foreign institutional flows also remain important.
Indian equities have experienced significant foreign selling during the recent correction, alongside pressure from global bond yields and other macro variables. Recent market commentary has also highlighted foreign outflows and bearish positioning as important factors behind the October market setup.
Flows alone, however, should not be used to time markets.
The more useful signal is how the market reacts to those flows.
For example, if foreign investors continue selling but Nifty stops making meaningful new lows, it may indicate that domestic buyers are increasingly absorbing the supply.
Conversely, persistent selling combined with deteriorating market breadth would strengthen the defensive case.
What Should Long-Term Investors Do Now?
The current chart does not justify either extreme.
It does not provide enough evidence to conclude that a major new bull market has begun.
But neither does the index reaching long-term support automatically justify abandoning equities.
For long-term investors, we believe the better approach is to distinguish between three separate decisions:
-
Existing portfolio: Evaluate whether individual businesses continue to have sound earnings trends, reasonable valuations and intact long-term price structures.
-
Fresh lump-sum capital: Deployment can remain gradual while the market determines whether the present support actually holds.
-
Long-term SIPs and financial goals: Strategic asset allocation decisions should not normally be changed simply because the index has had a weak month or reached a particular technical indicator.
The objective should be risk management rather than prediction.
Our Nifty Outlook for October 2026
At the current level, we would describe the Nifty as being in a medium-term corrective phase while testing major long-term support.
The 22,100–22,400 area deserves respect because of the concentration of several technical references.
At the same time, monthly momentum remains weak enough that a short-term rebound should not automatically be interpreted as the beginning of another large bull market.
The framework we are following is therefore:
-
Below 23,200: remain cautious.
-
Above 23,200: look for evidence of stabilisation.
-
Above roughly 23,800–24,000: the technical picture begins to improve materially.
-
A sustained break below 22,100–22,200: prepare for the possibility of a deeper correction.
There is one final point investors should remember.
The strongest investment opportunities often appear when markets are uncomfortable.
But price falling is not, by itself, evidence that an asset has become attractive.
Earnings, valuations, market breadth, liquidity and the behaviour of individual companies still matter.
That is why instead of attempting to predict the exact Nifty bottom, we would rather observe the evidence and adjust portfolios as that evidence changes.
Frequently Asked Questions
What is the important support level for Nifty in October 2026?
The broad technical support region is approximately 22,100–22,400, rather than one exact number. The April 2026 low near 22,183 and several longer-term technical references fall within this area. Recent market analysis has similarly highlighted the 22,200 region following Nifty's October 1 decline.
Is Nifty oversold?
Shorter-term momentum indicators have reached weak or oversold regions, but longer-term monthly momentum remains subdued. Oversold conditions can produce rebounds without necessarily ending a larger correction.
Can Nifty fall to 20,500?
Approximately 20,500–20,800 is one technical scenario if the present support fails. It should not be treated as a prediction. The market would first need to decisively break the 22,100–22,200 region and fail to recover it.
What would signal that the Nifty trend is improving?
A recovery above approximately 23,200 would be an initial improvement. A sustained move through roughly 23,800–24,000, preferably accompanied by stronger breadth and improving momentum, would represent more meaningful trend repair.
Should investors stop SIPs during a Nifty correction?
For long-term investors, SIP decisions should primarily reflect financial goals, time horizon, risk profile and strategic asset allocation rather than short-term index movements. Tactical deployment of additional lump-sum money is a separate decision.
Disclaimer
This article is intended for investor education and market research purposes. Market levels and technical indicators discussed are dynamic and may change. Technical analysis does not guarantee future returns or market outcomes. Investment decisions should be based on an investor's objectives, risk profile, financial circumstances and other relevant factors. Past performance is not indicative of future results.